

FINANCIAL PROFESSIONALS ONLY
U.S. Small-Cap Market Overview
June 30, 2026


Table of Contents
5Year-to-Date Small-Cap Overview as of 6/30/26
62Q26 Sector and Industry Review
7Year-to-Date Sector and Industry Review
8Despite Recent Outperformance Small-Caps Remain Near Low Versus Large-Caps
9Small-Cap Significantly Cheaper than Large-Cap Size Segments
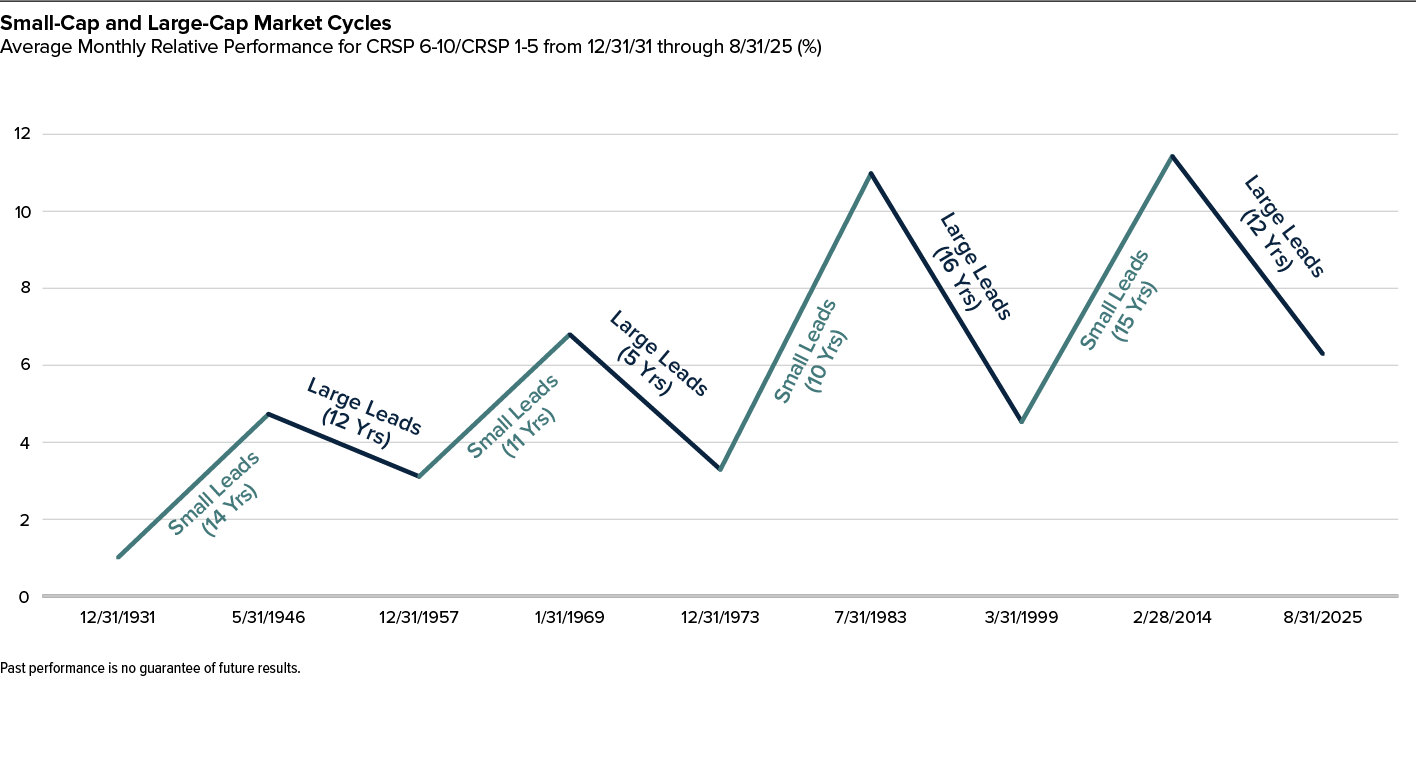
11Historically Small-Cap Cycles Have Averaged More Than a Decade
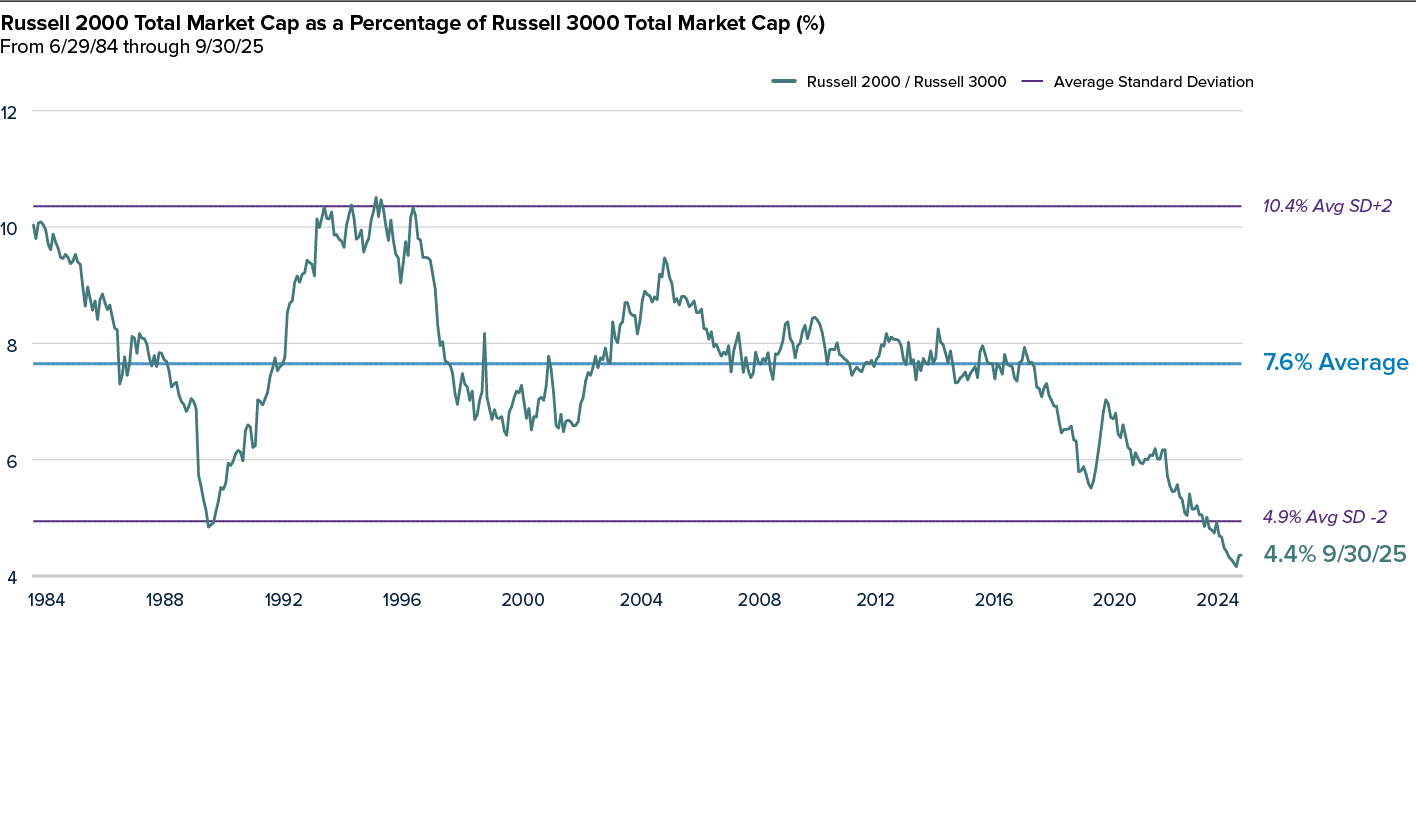
12Small-Cap’s Weight in the Russell 3000 Is Below Historical Low
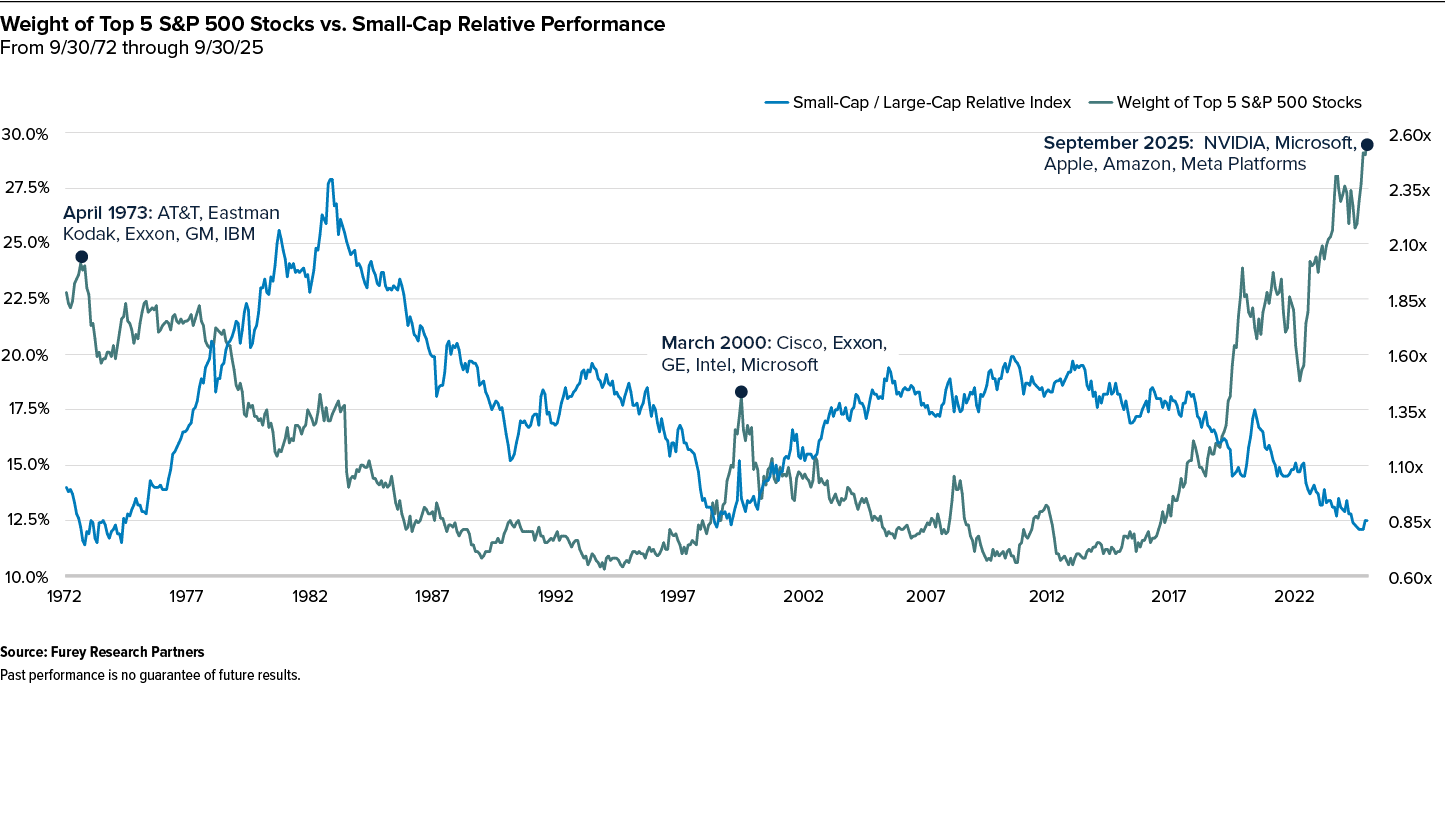
13Large-Cap Cycles Peak at Market Tops Crowded with Mega-Caps
14Relative Valuations for Small-Caps vs. Large-Caps Are Still Below Average
16Small-Cap Earnings Growth—Secular Tailwinds
17Small-Cap’s Estimated Earnings Growth is Expected to Be Higher Than Large-Cap’s in 2026 and 2027
18Earnings Lead Small-Cap Returns
19Small-Cap 3-Year Returns Following Highly Volatile Markets Have Led Large-Cap’s
20When the Equal-Weighted Russell 1000 Outperformed, Small-Cap Generally Led
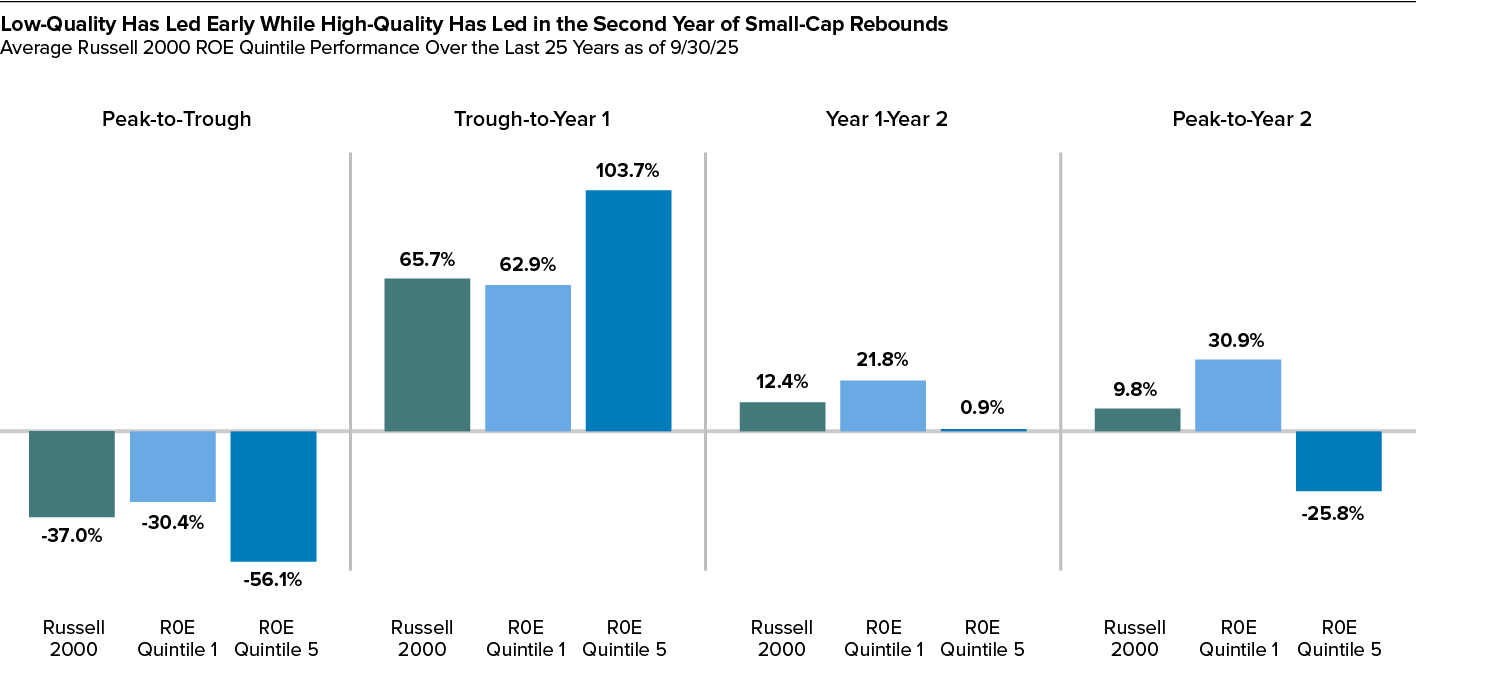
21High-Quality and Low-Quality Small-Cap Stocks Have Historically Had Different Performance Profiles
22The Most Alpha Generation Potential Remains in Small-Cap
23Active Small-Cap Has Historically Outperformed in Broadening Markets
24Large Intra-Year Declines Are Frequent
U.S. Small Cap Market Overview Royce Investment Partners
PAGE 2

Market Overview
In the bullish second quarter of 2026, small- and micro- cap stocks continued to lead the U.S. equity markets in a robust period for equities of all sizes and styles. Resilience amid mixed signals was once again the main theme, as geopolitical tensions remain unresolved, inflation lingers, and energy prices are still volatile, depending on the changing state of the war with Iran on any given day. On the plus side, the economy is still in solid shape. Consumers are spending, even as they report lower confidence in economic growth, while the AI buildout continues to gain momentum (though not without controversies of its own, most notably around the enormous amount of energy needed to power data centers).
Against this backdrop, U.S, stocks roared back from the low or negative returns in 1Q26. For the second quarter, the Russell 2000 Index rose 21.5%, and the Russell Microcap Index gained 25.6%, versus respective gains of 15.1% and 10.7% for the large-cap Russell 1000 Index and mega-cap Russell Top 50 Index. (The tech-heavy Nasdaq Composite was up 21.6% for the same period.)
For the quarter ended June 30, 2026, small-cap performance broadened across most sectors, led by Information Technology, Health Care, and Industrials. While Energy was the lone sector to post a decline, the strength across much of the market reflected improving earnings expectations and growing investor confidence. We continue to believe that strengthening fundamentals, attractive relative valuations, and growing earnings strength provide a supportive backdrop for small-cap stocks.
Looking ahead, the backdrop for small-caps remains constructive over the longer term. Attractive relative valuations, improving market breadth, and the early stages of an earnings recovery could support sustained leadership, particularly if economic growth remains intact. At the same time, risks tied to earnings execution, funding conditions, and macro uncertainty persist. With dispersion still elevated, we believe active, fundamentals-driven strategies focused on balance sheet strength, sustainable margins, and consistent profitability remain well positioned for this phase of the small-cap cycle.
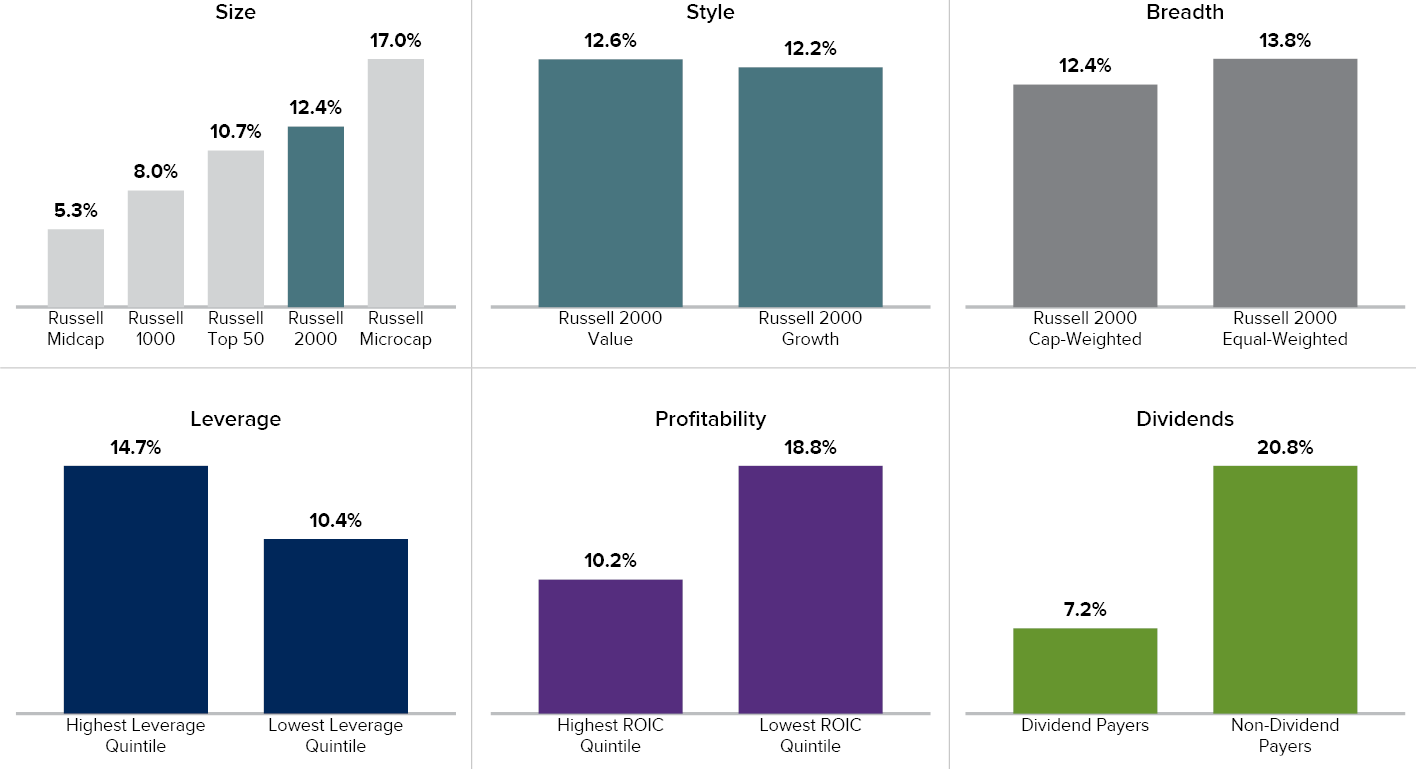
2Q26 Small-Cap Overview
The highest returns went to the smallest stocks during the second quarter of 2026, as smaller capitalization segments continued to benefit from broader market leadership. Within the Russell 2000, small-cap growth outperformed small-cap value, while higher-leverage and lower-profitability stocks outperformed their lower-leverage and higher-profitability counterparts; non-dividend-paying companies outpaced dividend payers during the quarter.
U.S. Small Cap Market Overview Royce Investment Partners
PAGE 4
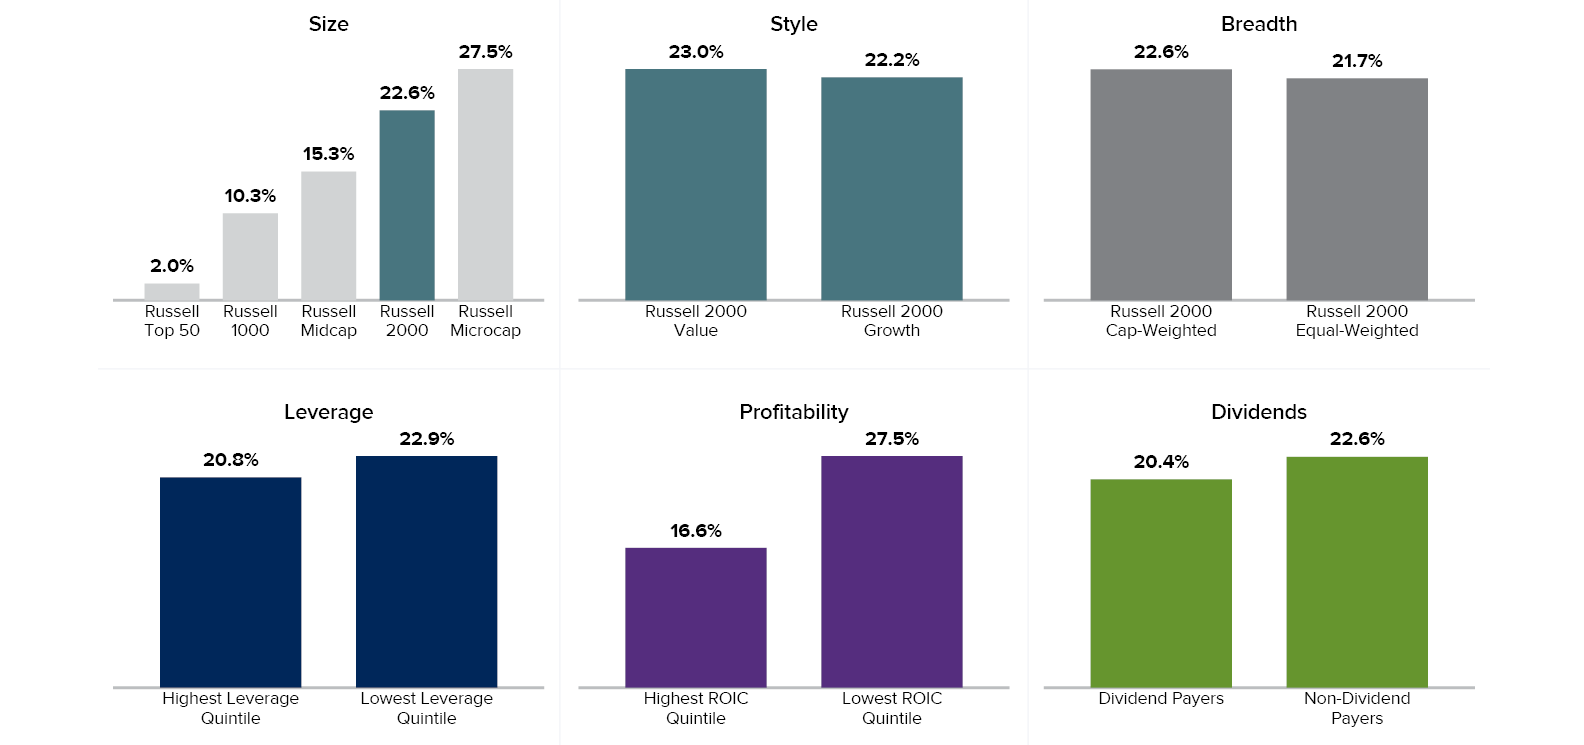
Year-to-Date Small-Cap Overview as of 6/30/26
For the year-to-date period ended 6/30/26, the Russell 2000 advanced 22.6%, while the Russell Microcap increased 27.5% compared to a gain of 10.3% for the Russell 1000 and 2.0% for the Russell Top 50. For the 1-year period ended 6/30/26, the Russell 2000 was up 40.8%, the Russell Microcap gained 58.5%, the Russell 1000 was up 22.0%, and the Russell Top 50 returned 16.3%. In the small-cap asset class, two areas stood out: value performed better than growth and lowest ROIC outperformed the highest ROIC by a wide margin.
U.S. Small Cap Market Overview Royce Investment Partners
PAGE 5
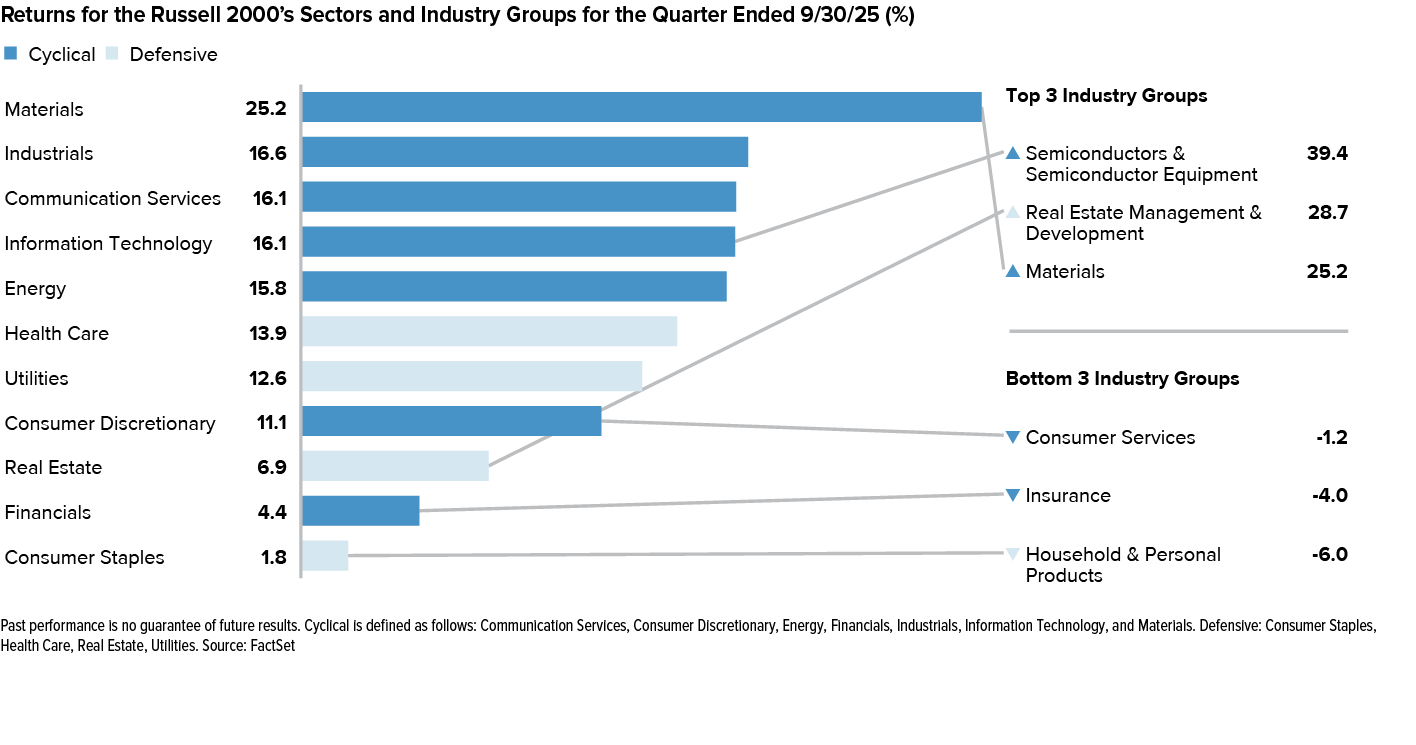
2Q26 Sector and Industry Review
Sector performance within the Russell 2000 was highly dispersed for the quarter ended June 30, 2026, with Information Technology delivering a standout gain of 56.1%, far outpacing all other sectors. Health Care and Industrials also posted strong advances, while Real Estate, Financials, Consumer Discretionary, and Communication Services generated solid double-digit returns. More defensive sectors such as Consumer Staples and Utilities lagged, with modest gains of 10.2% and 0.1%, respectively. Energy was the only sector to decline, falling 10.1%, underscoring the wide dispersion in returns and the quarter’s pronounced leadership from technology-related industries.
U.S. Small Cap Market Overview Royce Investment Partners
PAGE 6
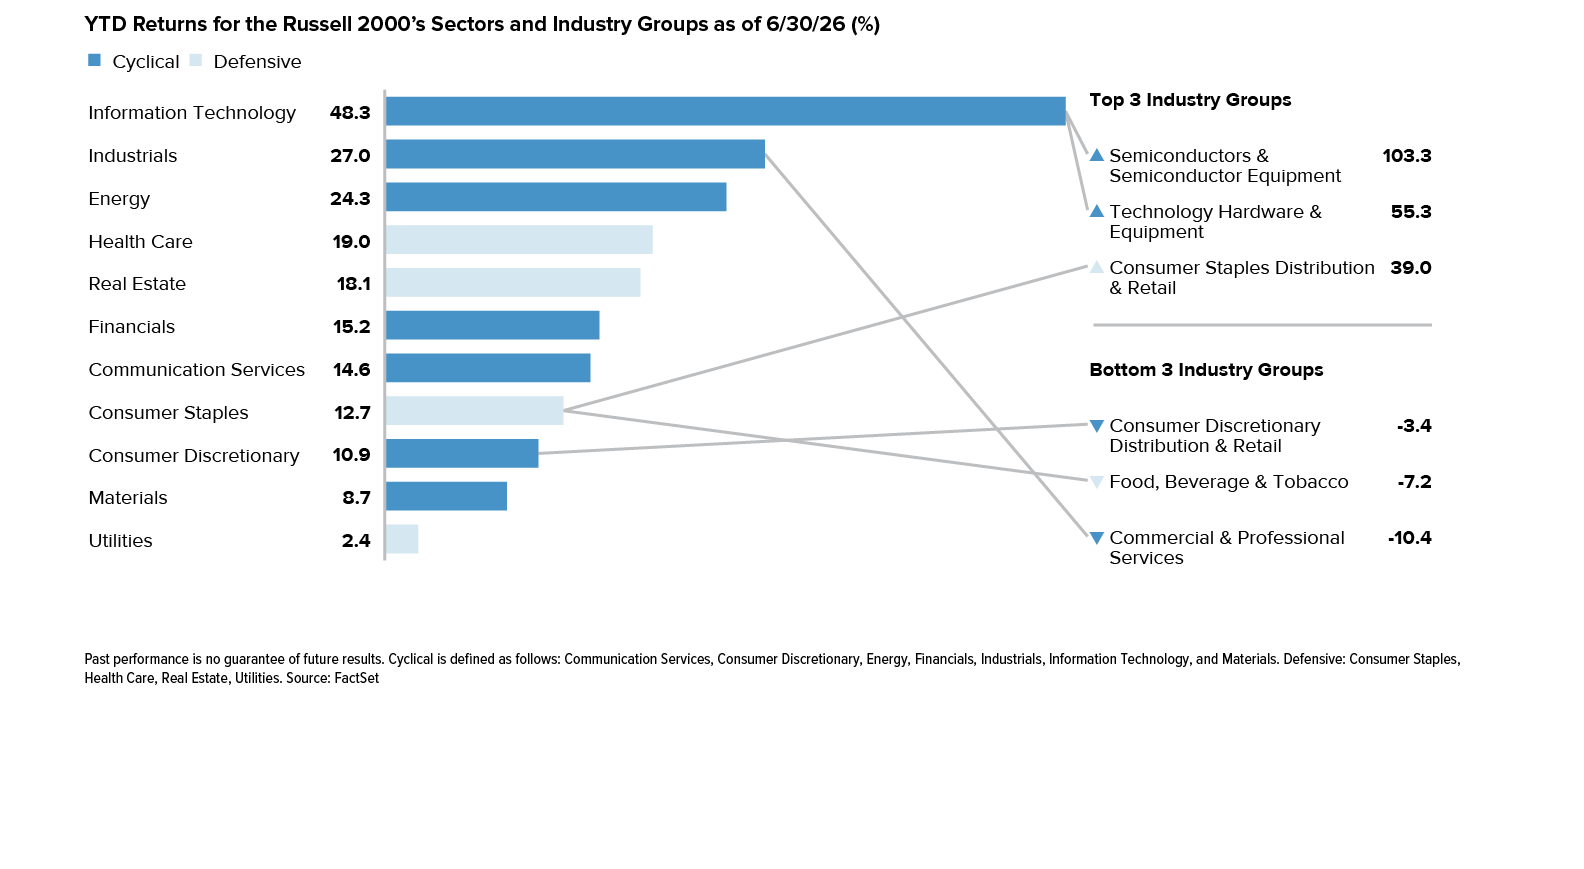
Year-to-Date Sector and Industry Review
Year-to-date sector performance within the Russell 2000 through June 30, 2026, remained highly dispersed, with Information Technology leading by a wide margin, gaining 48.3%. Industrials and Energy also posted strong advances of 27.0% and 24.3%, respectively, while Health Care, Real Estate, Financials, and Communication Services generated solid double-digit returns. More defensive sectors such as Consumer Staples and Utilities lagged, though both remained positive. Materials and Consumer Discretionary also finished higher but trailed the market leaders, underscoring the broad yet uneven nature of small-cap performance through the first half of the year.
U.S. Small Cap Market Overview Royce Investment Partners
PAGE 7
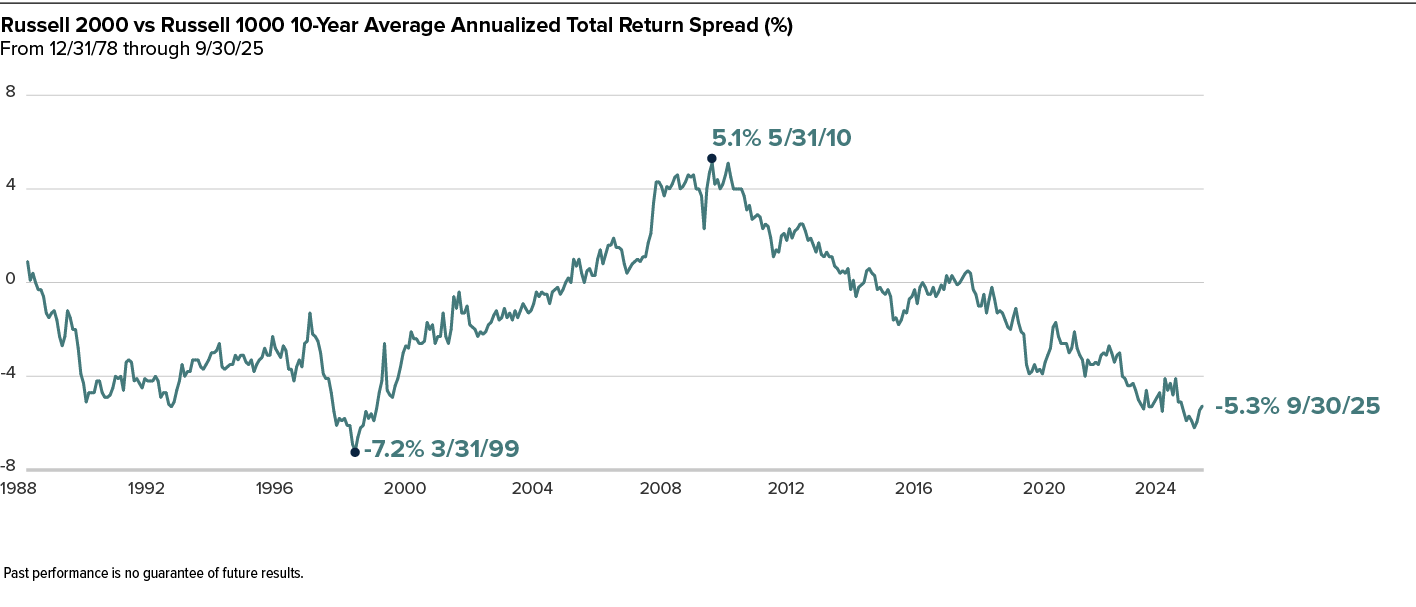
Despite Recent Outperformance Small-Caps Remain Near Low Versus Large-Caps
U.S. Small Cap Market Overview Royce Investment Partners
PAGE 8
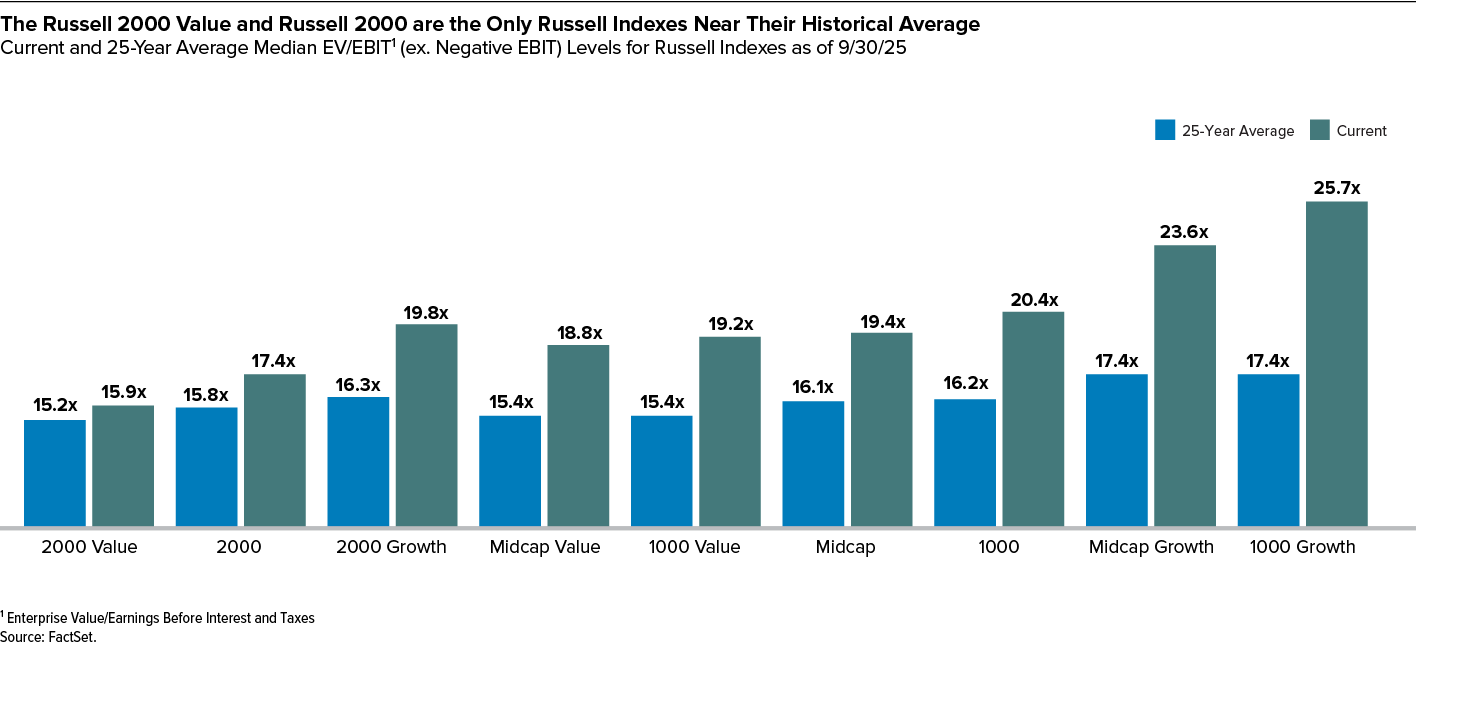
Small-Cap Significantly Cheaper than Large-Cap Size Segments
Four observations leap out when comparing valuations across various segments of the U.S. equity market as represented below by the Russell Indexes: 1) Small-Cap Value and Small-Cap Core are the cheapest segments of U.S. equities, 2) these segments are the only ones slightly above their 25-year average valuation, 3) while all three value segments (Small-Cap, Mid-Cap, and Large-Cap) have very similar 25-year average valuations, their current valuations are vastly different, and 4) Mid-Cap Growth, Large-Cap Growth, and overall Large-Cap valuations still have a long way to fall to reach their 25-year average valuations.
U.S. Small Cap Market Overview Royce Investment Partners
PAGE 9

Historical Perspective
Elevated valuations across U.S. equities have remained a persistent theme, though much of this focus continues to center on larger-cap stocks—whether the Magnificent Seven, the Nasdaq 100, or the S&P 500. In our view, small-cap stocks still stand apart, remaining more reasonably valued than their larger-cap counterparts.
Two long-term observations continue to frame this valuation gap. Historically, the Russell 2000 has represented an average of approximately 7.6% of the Russell 3000’s total market capitalization. As of June 30, 2026, however, small-caps accounted for roughly 4.5% of the index—still well below that long-term average. In addition, based on enterprise value to earnings before interest and taxes (EV/EBIT), small-cap valuations remain meaningfully below those of large-caps, even after the recovery from the April 2025 market lows.
From a longer-term perspective, we believe the case for small-caps remains compelling. Improving earnings growth, attractive relative valuations, and the potential for lower borrowing costs continue to provide a supportive backdrop for the asset class. Against this backdrop, we continue to see attractive opportunities among high-quality small-cap businesses with durable fundamentals and disciplined capital allocation.
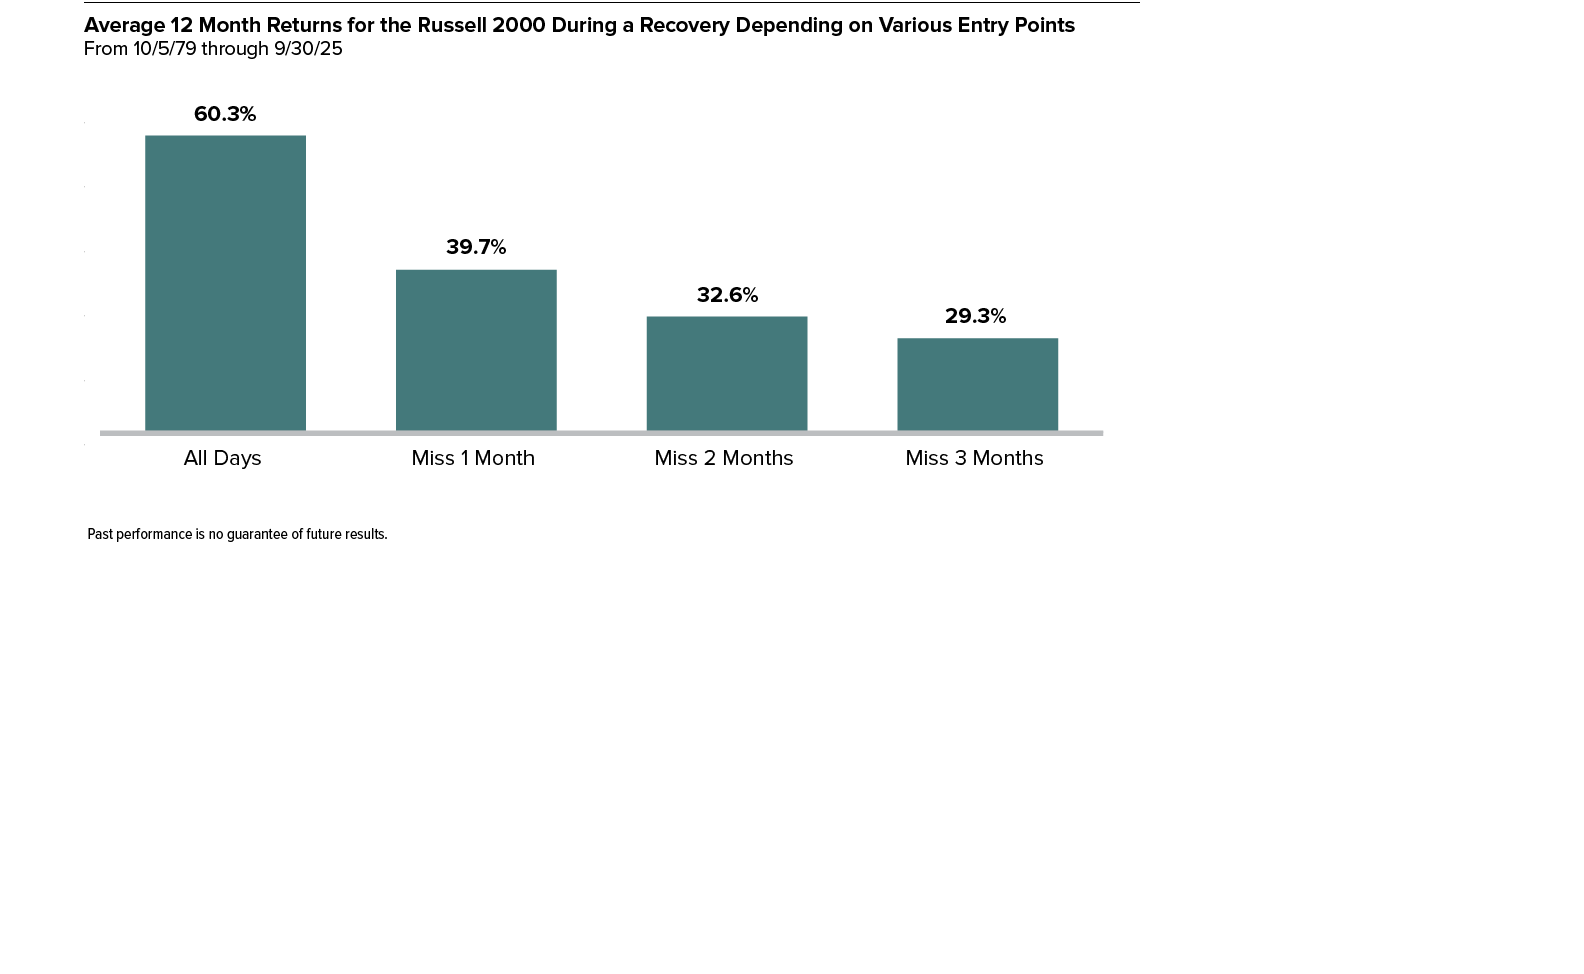
Historically Small-Cap Cycles Have Averaged More Than a Decade
Secular changes in economic trends, interest rates, and monetary and fiscal policies continue to alter the long-term investment landscape. The winners under the past decade’s zero interest rate, low inflation, and low nominal growth regime will no longer lead. The unfolding macro environment points to the small-cap asset class being able to sustain, not just tactically outperform, large-cap.
U.S. Small Cap Market Overview Royce Investment Partners
PAGE 11
Small-Cap’s Weight in the Russell 3000 Is Below Historical Low
Small-cap’s long-term underperformance versus large-cap has reached such an extreme point that small-cap’s weight in the Russell 3000 sits at historical lows not seen since the early 1990s, another indicator suggesting that a sustained small-cap rebound may be here.

U.S. Small Cap Market Overview Royce Investment Partners
PAGE 12
Large-Cap Cycles Peak at Market Tops Crowded with Mega-Caps
U.S. Small Cap Market Overview Royce Investment Partners
PAGE 13
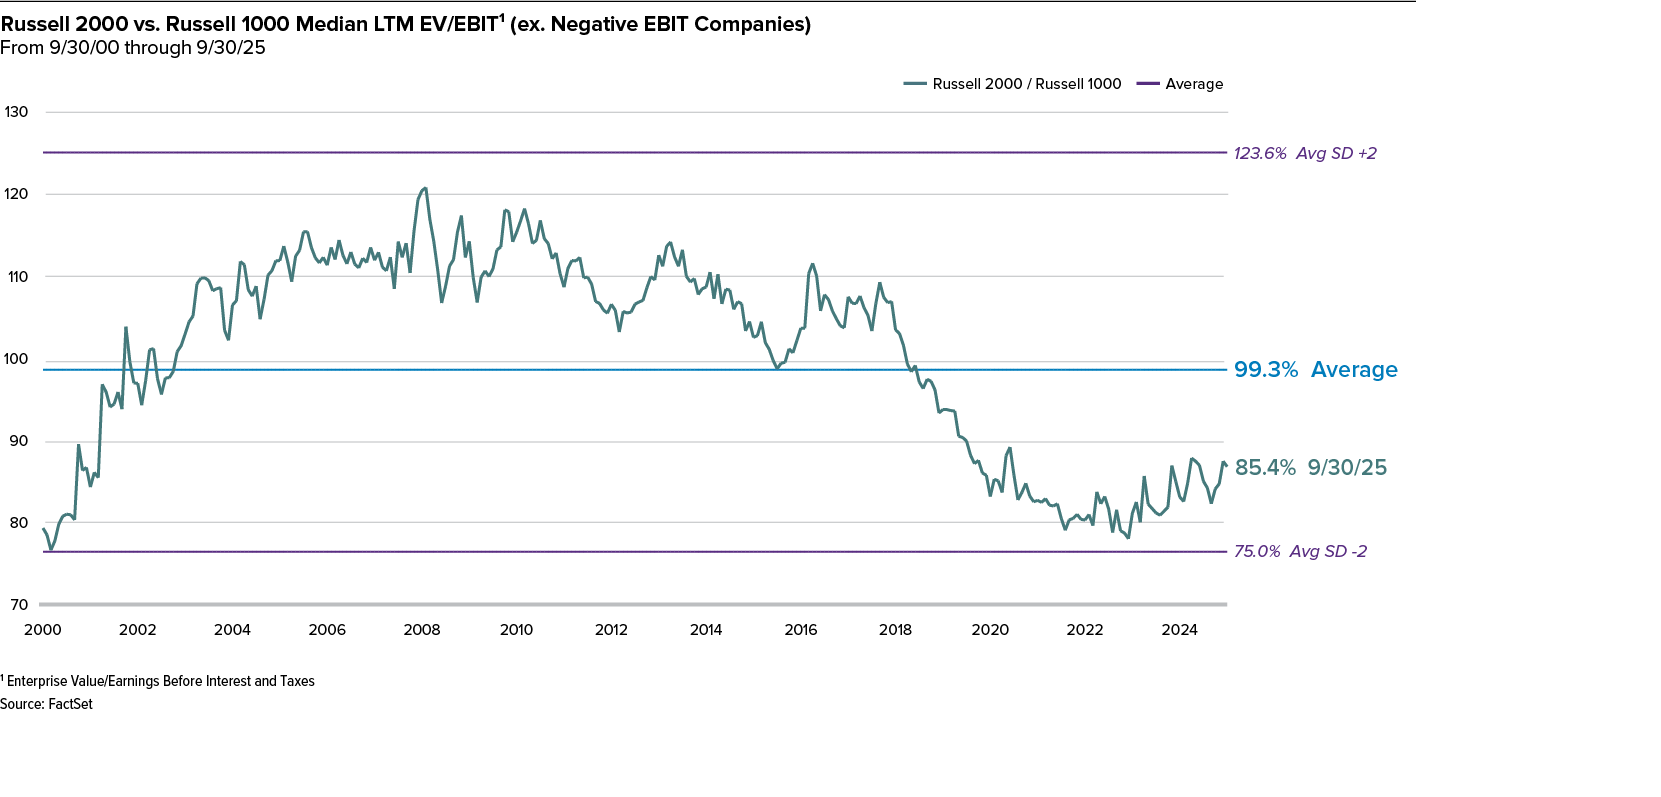
Relative Valuations for Small-Caps vs. Large-Caps Are Still Below Average
Even with recent outperformance, the Russell 2000 remains extremely undervalued compared to its relative valuation range over the past 25 years.
U.S. Small Cap Market Overview Royce Investment Partners
PAGE 14

Small-Cap Market Outlook
We remain constructive on the long-term outlook for U.S. small-cap equities, even as uncertainty continues to influence the near-term investment landscape. While investors continue to monitor evolving trade policy, fiscal and monetary developments, and geopolitical risks, the underlying fundamentals for many small-cap companies have improved. We believe strengthening earnings growth, attractive relative valuations, and a broadening market environment provide a favorable backdrop for active small-cap investing. In addition, many domestically focused businesses remain well positioned to benefit from long-term secular trends, including reshoring, infrastructure investment, and the continued modernization of U.S. manufacturing.
As of June 30, 2026, small-cap stocks remained meaningfully less expensive than large-caps. Based on EV/EBIT, our preferred valuation measure, the Russell 2000 continues to trade near the lower end of its historical relative valuation range versus the Russell 1000, even after recovering from the April 2025 market low. Small-caps’ weight in the Russell 3000 also remains near historical lows, underscoring how much the asset class has lagged larger companies in recent years.
At the same time, earnings fundamentals have continued to improve across much of the small-cap universe. Stronger earnings growth, combined with attractive relative valuations, has been an important driver of recent small-cap performance. We believe these fundamentals continue to create compelling opportunities for active, long-term investors focused on identifying high-quality businesses with durable competitive advantages and disciplined capital allocation.
Small-Cap Earnings Growth—Secular Tailwinds
Earnings growth prospects for small-cap companies appear to be improving after a prolonged period of pressure, as many emerge from a multi-year downturn and can grow off a lower earnings base as financial conditions stabilize and fundamentals improve. Historically, these inflection points have often helped drive small-cap performance in the early to middle stages of market recoveries. Because small-caps are typically more domestically oriented and operationally leveraged than larger firms, improving demand, easing cost pressures, and better access to capital, alongside supportive secular and cyclical forces, can translate into outsized earnings growth over time.
U.S. Small Cap Market Overview Royce Investment Partners
PAGE 16
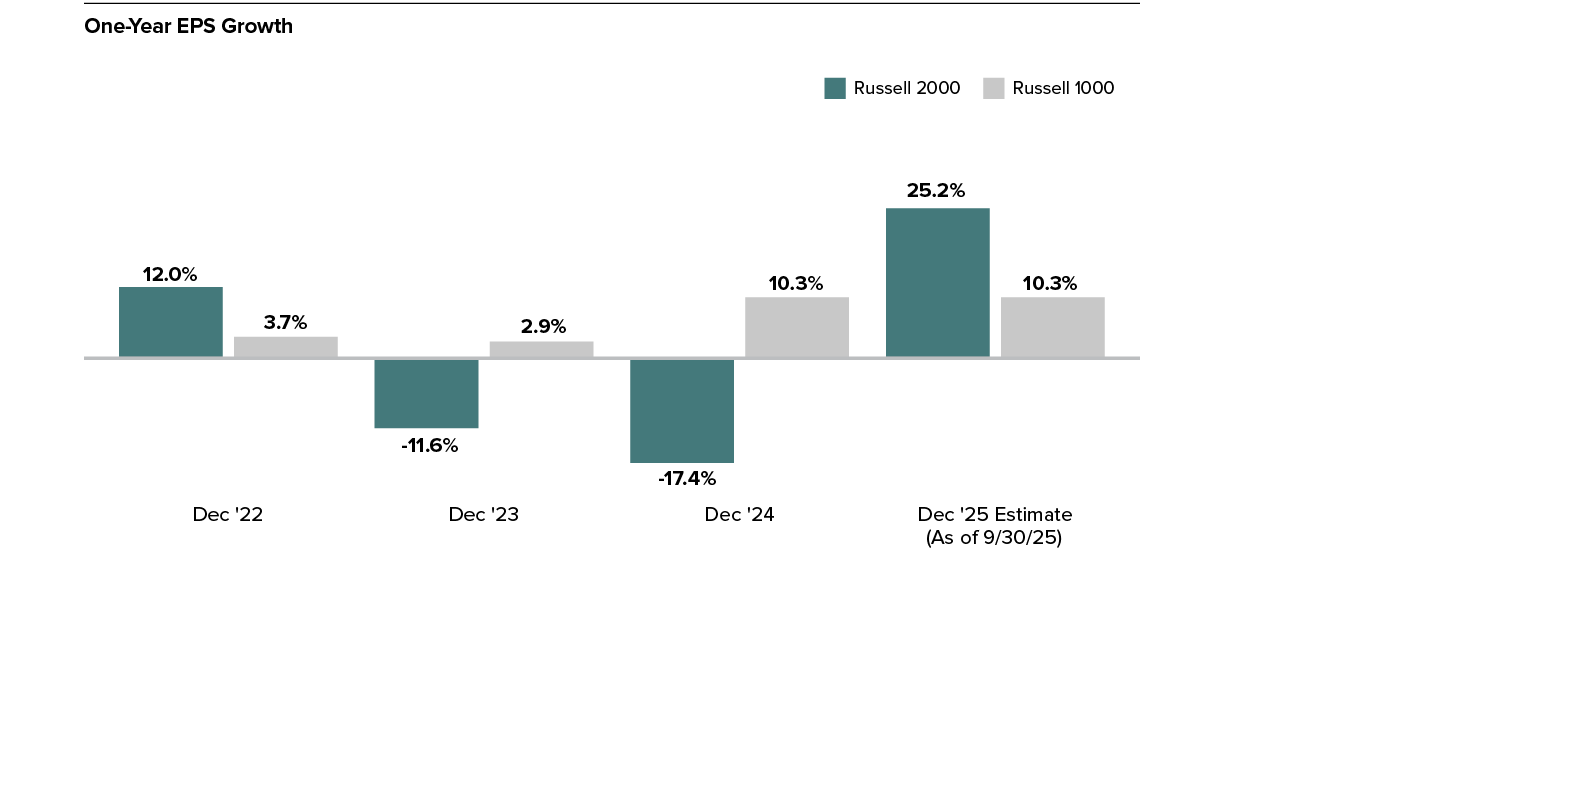
Small-Cap’s Estimated Earnings Growth is Expected to Be Higher Than Large-Cap’s in 2026 and 2027
Consensus EPS estimates for the Russell 2000 are considerably higher than they are for the Russell 1000 for the rest of 2026 and into 2027.

U.S. Small Cap Market Overview Royce Investment Partners
PAGE 17
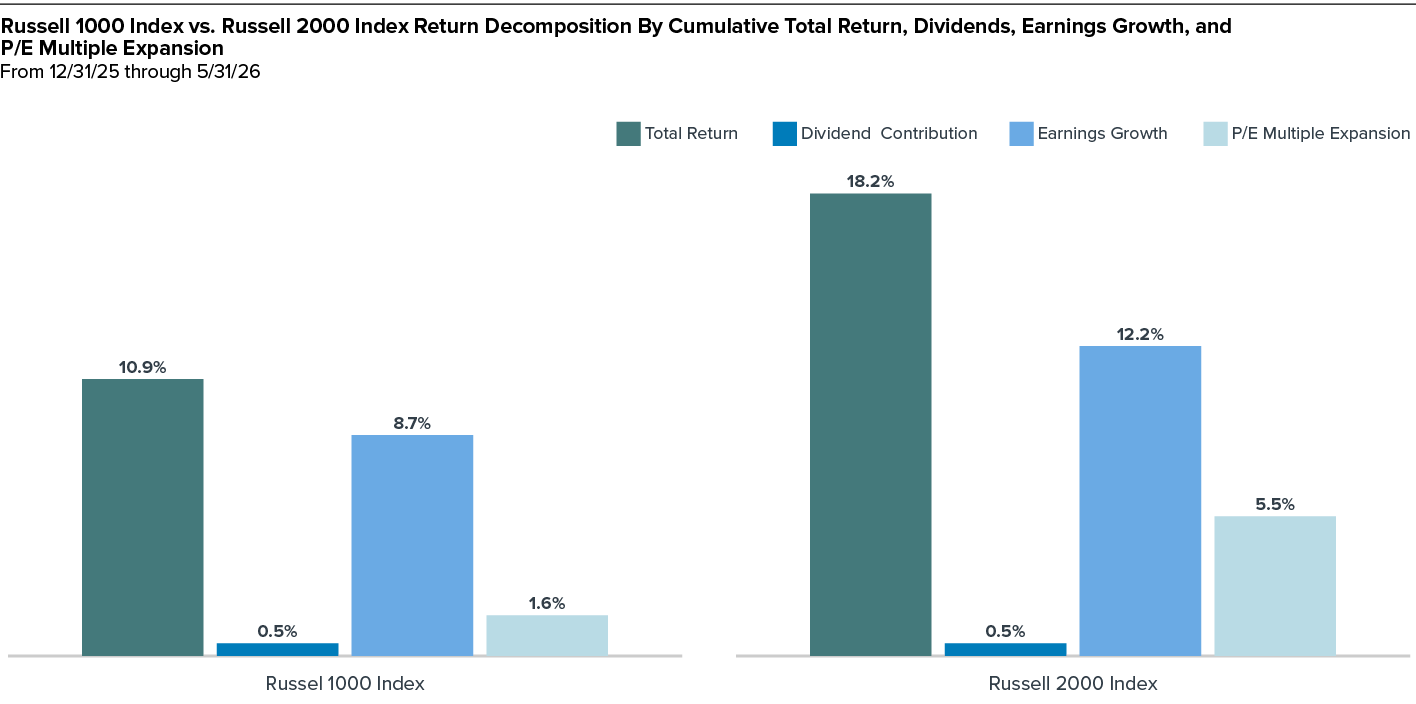
Earnings Lead Small-Cap Returns
The Russell 2000’s stronger returns are being supported by both robust earnings growth and expanding valuations. We continue to believe that improving earnings fundamentals, coupled with attractive relative valuations, provide a compelling backdrop for active small-cap investing.
U.S. Small Cap Market Overview Royce Investment Partners
PAGE 18
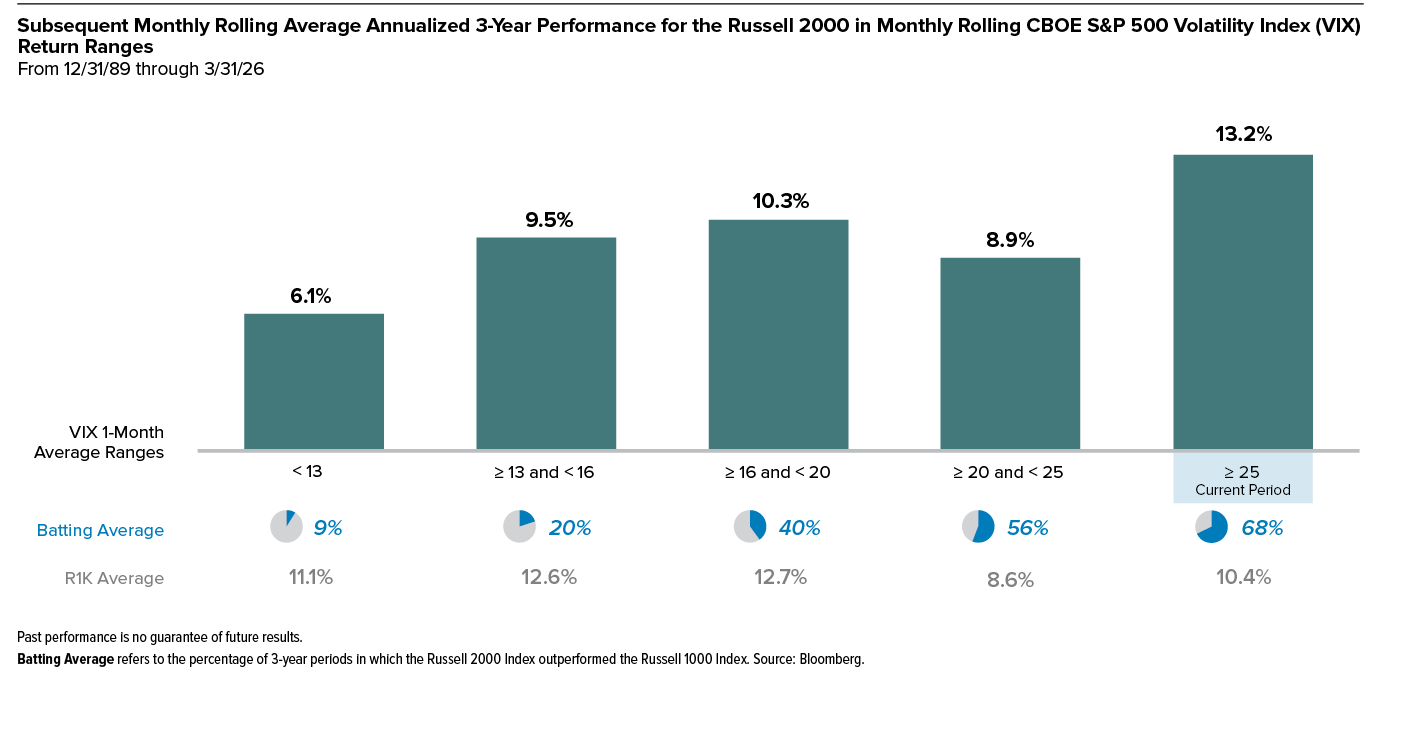
Small-Cap 3-Year Returns Following Highly Volatile Markets Have Led Large-Cap’s
Higher market volatility has historically been associated with stronger subsequent small-cap returns, with 3-year annualized performance rising to an average of 13.2% when the VIX is above 25, as it was at the end of June. The likelihood of small-cap outperformance versus large-cap also increases in these environments, as reflected by a higher batting average at elevated volatility levels.
U.S. Small Cap Market Overview Royce Investment Partners
PAGE 19
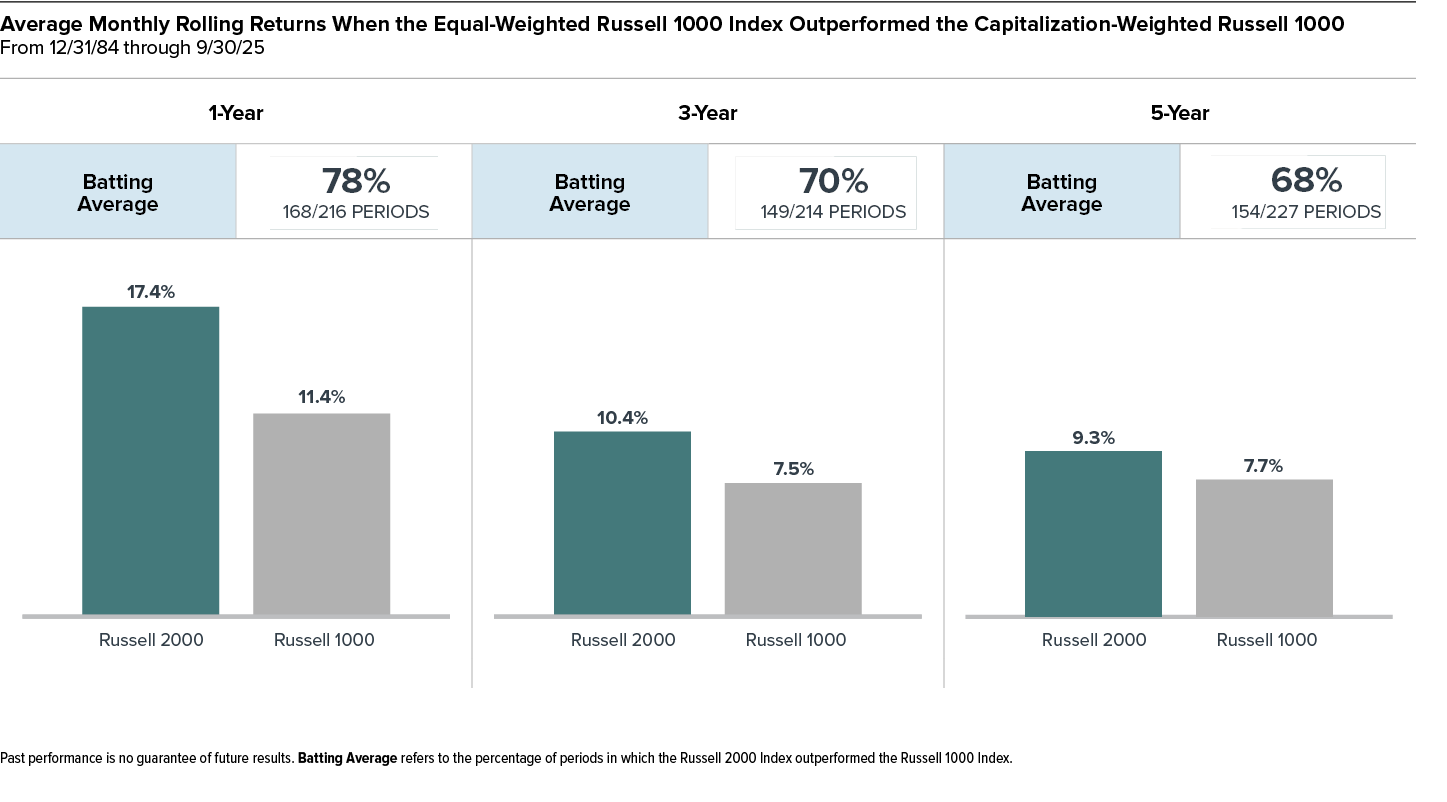
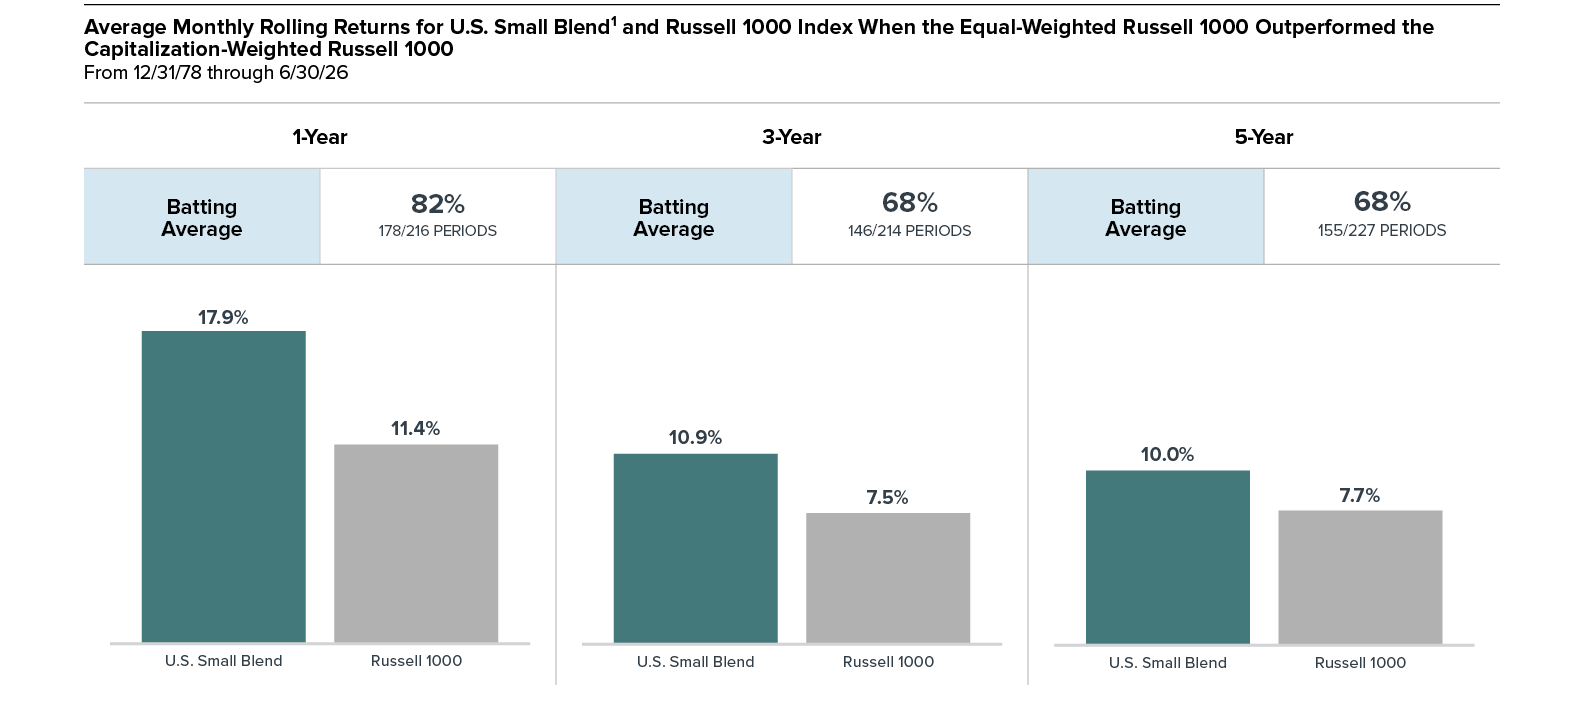
When the Equal-Weighted Russell 1000 Outperformed, Small-Cap Generally Led
Our research shows that when large-cap returns broaden, small-caps outperform. When the equal-weighted Russell 1000 beat the capitalization-weighted Russell 1000, the Russell 2000 outperformed the large-cap index over the majority of rolling 1-, 3-, and 5-year periods going back to 1984.
U.S. Small Cap Market Overview Royce Investment Partners
PAGE 20
High-Quality and Low-Quality Small-Cap Stocks Have Historically Had Different Performance Profiles

U.S. Small Cap Market Overview Royce Investment Partners
PAGE 21
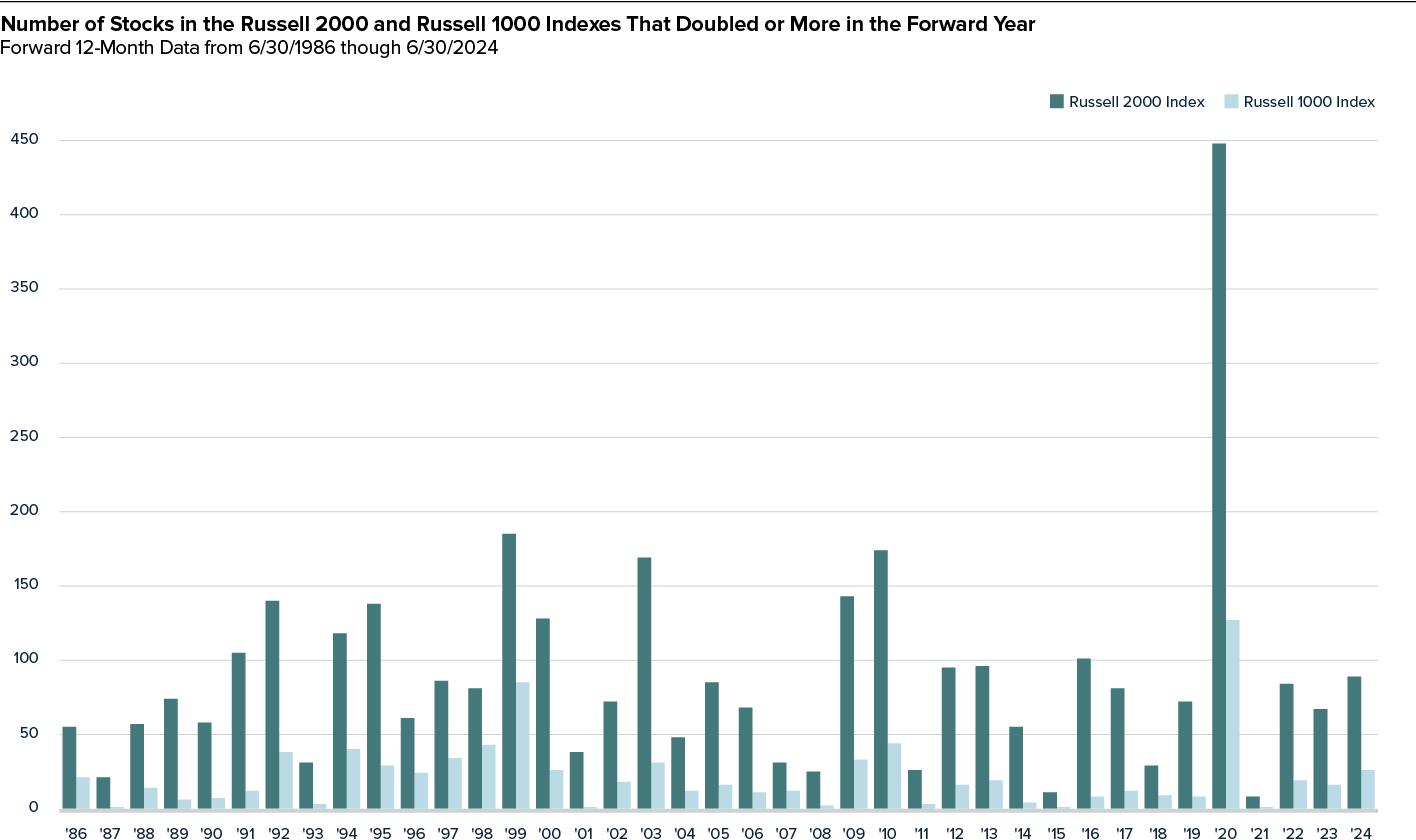
The Most Alpha Generation Potential Remains in Small-Cap
Historically, small-cap equities have offered an opportunity set for active managers because of greater dispersion, less analyst coverage, and a broader universe. As the chart shows, the Russell 2000 has produced many more stocks that doubled (or more) over subsequent 12-month periods than the Russell 1000, underscoring the depth of potential alpha in small-caps. In our view, valuations, improving earnings dynamics, and elevated dispersion create an environment for active, fundamentals-driven small-cap investing.

U.S. Small Cap Market Overview Royce Investment Partners
PAGE 22
Active Small-Cap Has Historically Outperformed in Broadening Markets
Active small-cap managers have historically outperformed during periods when market leadership broadened beyond the largest stocks. As market participation widens, the larger opportunity set has historically created a more favorable backdrop for active managers to add value.

U.S. Small Cap Market Overview Royce Investment Partners
PAGE 23
Large Intra-Year Declines Are Frequent
Large intra-year declines are common for small-cap stocks, with the Russell 2000 experiencing an average drawdown of about -19.6%, yet calendar-year returns have still averaged a healthy 10.2%. This pattern highlights that short-term volatility has historically not prevented longer-term gains for the asset class.
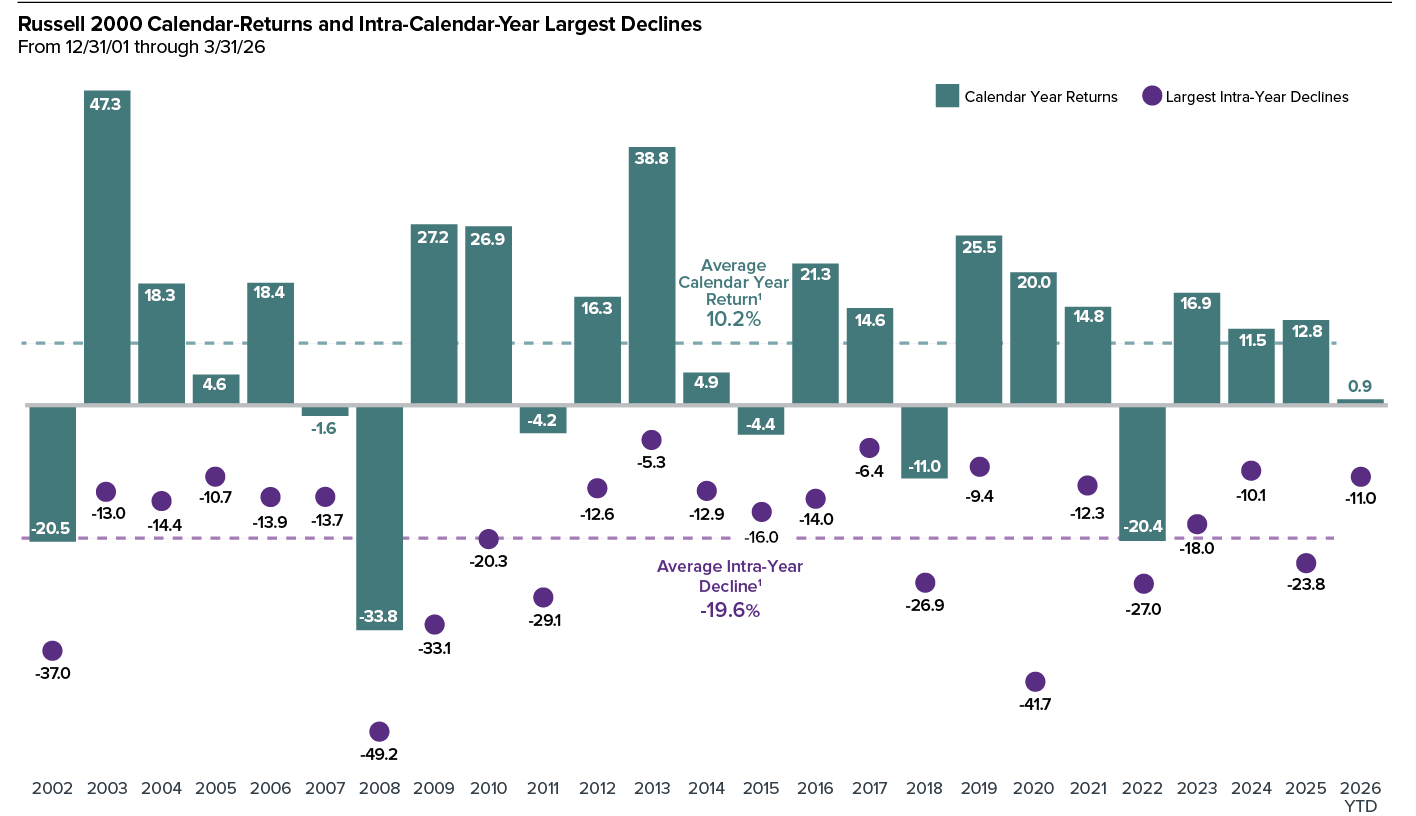
1Year-to-date data is not included in averages. Past performance is no guarantee of future results.
U.S. Small Cap Market Overview Royce Investment Partners
PAGE 24
Key Takeaways for 2Q26
Market Overview
U.S. small-cap and micro-cap stocks led the broader equity market during the strong second quarter, supported by resilient economic conditions, improving earnings expectations, and broader market participation. Performance was positive across most small-cap sectors, with Information Technology, Health Care, and Industrials leading, while Energy was the only sector to decline. The smallest capitalization segments generated the strongest returns, and small-cap growth outpaced small-cap value during the quarter. Although geopolitical tensions, persistent inflation, volatile energy prices, and funding risks remain, attractive relative valuations, strengthening fundamentals, and the potential for lower borrowing costs continue to support the longer-term case for small-cap equities.
With dispersion still elevated, we believe active, fundamentals-driven strategies focused on balance sheet strength, sustainable margins, and consistent profitability remain well positioned to identify opportunities across the small-cap market. The breadth of the recent advance also suggests that leadership is expanding beyond the largest companies, creating a potentially more favorable environment for selective small-cap investing.
Historical Perspective
Despite their recent outperformance, small-cap stocks remain more reasonably valued than their larger-cap counterparts and continue to represent a historically low share of the U.S. equity market. As of June 30, 2026, the Russell 2000 accounted for approximately 4.5% of the Russell 3000’s market capitalization, compared with its long-term average of roughly 7.6%, while relative EV/EBIT valuations remained meaningfully below those of the Russell 1000. The Russell 2000’s 10-year annualized return also continued to trail the Russell 1000 by a historically wide margin, underscoring the extent of the asset class’s prolonged relative underperformance.
Historically, small-cap and large-cap leadership cycles have often persisted for more than a decade, suggesting that changes in market leadership can be durable rather than merely tactical. In our view, this extended period of relative underperformance, combined with improving earnings growth, attractive valuations, and the potential for lower borrowing costs, continues to create a compelling long-term opportunity set among high-quality small-cap businesses with durable fundamentals and disciplined capital allocation.
U.S. Small Cap Market Overview Royce Investment Partners
PAGE 25
Key Takeaways for 2Q26 (continued)
Small-Cap Market Outlook
We remain positive on the long-term outlook for U.S. small-cap equities, even as trade policy, fiscal and monetary developments, and geopolitical risks continue to influence the near-term environment. Strengthening earnings growth, attractive relative valuations, and broadening market leadership provide a favorable backdrop, while domestically focused companies may also benefit from secular trends such as reshoring, infrastructure investment, and the modernization of U.S. manufacturing. Additional potential tailwinds include a more favorable rate environment, tax policy, deregulation, and productivity gains from artificial intelligence adoption.
Small-cap earnings fundamentals have continued to improve, and consensus estimates indicate that Russell 2000 earnings growth could meaningfully exceed that of the Russell 1000 in both 2026 and 2027. Improving earnings and expanding valuations have already contributed to recent small-cap returns, while historically high market volatility and broader market participation have often preceded favorable relative performance. We believe this environment remains favorable for active long-term investors.
U.S. Small Cap Market Overview Royce Investment Partners
PAGE 26

The performance data and trends outlined in this presentation are presented for illustrative purposes only. All performance information is presented on a total return basis and reflects the reinvestment of distributions. Past performance is no guarantee of future results. Historical market trends are not necessarily indicative of future market movements. The Russell 2000 Index is an unmanaged, capitalization-weighted index of domestic small-cap stocks. It measures the performance of the 2,000 smallest publicly traded U.S. companies in the Russell 3000 Index. The Russell 2000 Value and Growth indexes consist of the respective value and growth stocks within the Russell 2000 as determined by Russell Investments. The Russell 1000 index is an unmanaged, capitalization-weighted index of domestic large-cap stocks. It measures the performance of the 1,000 largest publicly traded U.S. companies in the Russell 3000 index. The Russell Top 50 Mega Cap Index is an unmanaged, capitalization-weighted index of domestic mega-cap stocks that measures the performance of the 50 largest publicly traded U.S. companies in the Russell 3000 index. The Russell Midcap Index measures the performance of the mid-cap segment of the U.S. equity universe. It includes approximately 800 of the smallest securities in the Russell 1000 Index. The Russell Midcap Value and Growth Indexes consist of the respective value and growth stocks within the Russell Midcap as determined by Russell Investments. The Russell 1000 index is an unmanaged, capitalization-weighted index of domestic large-cap stocks. It measures the performance of the 1,000 largest publicly traded U.S. companies in the Russell 3000 index. The Russell 1000 Value and Growth indexes consist of the respective value and growth stocks within the Russell 1000 as determined by Russell Investments. The Bloomberg Barclays US Aggregate Bond Index is an unmanaged, capitalization-weighted index of investment grade, US dollar-denominated, fixed-rate taxable bonds. Frank Russell Company (“Russell”) is the source and owner of the trademarks, service marks and copyrights related to the Russell Indexes. Russell® is a trademark of Frank Russell Company. Neither Russell nor its licensors accept any liability for any errors or omissions in the Russell Indexes and / or Russell ratings or underlying data and no party may rely on any Russell Indexes and / or Russell ratings and / or underlying data contained in this communication. No further distribution of Russell Data is permitted without Russell’s express written consent. Russell does not promote, sponsor or endorse the content of this communication. The S&P 500 is an index of U.S. large-cap stocks selected by Standard & Poor’s based on market size, liquidity, and industry grouping, among other factors, and includes reinvested dividends. The (Center for Research in Security Prices) CRSP (Center for Research in Security Pricing) equally divides the companies listed on the NYSE into 10 deciles based on market capitalization. Deciles 1-5 represent the largest domestic equity companies and Deciles 6-10 represent the smallest. CRSP then sorts all listed domestic equity companies based on these market cap ranges. By way of comparison, the CRSP 1-5 would have similar capitalization parameters to the S&P 500 and the CRSP 6-10 would have similar capitalization parameters to those of the Russell 2000. Index returns include net reinvested dividends and/or interest income. The performance of an index does not represent exactly any particular investment, as you cannot invest directly in an index. Royce & Associates, LP, the investment advisor of The Royce Fund and Royce Capital Fund, is a limited partnership organized under the laws of Delaware. Royce & Associates, LP primarily conducts its business under the name Royce Investment Partners.
Sector and industry weightings are determined using the Global Industry Classification Standard (“GICS”). GICS was developed by, and is the exclusive property of, Standard & Poor’s Financial Services LLC (“S&P”) and MSCI Inc. (“MSCI”). GICS is the trademark of S&P and MSCI. “Global Industry Classification Standard (GICS)” and “GICS Direct” are service marks of S&P and MSCI.

Notes, Performance, and Risk Disclosure

One Madison Avenue | New York, NY 10010 | P (800) 348-1414 | www.royceinvest.com
Client Services Group | P (800) 33-ROYCE (800-337-6923)